Solestyles Boutique’s Digital Transformation – Alternative Option – Power Pages
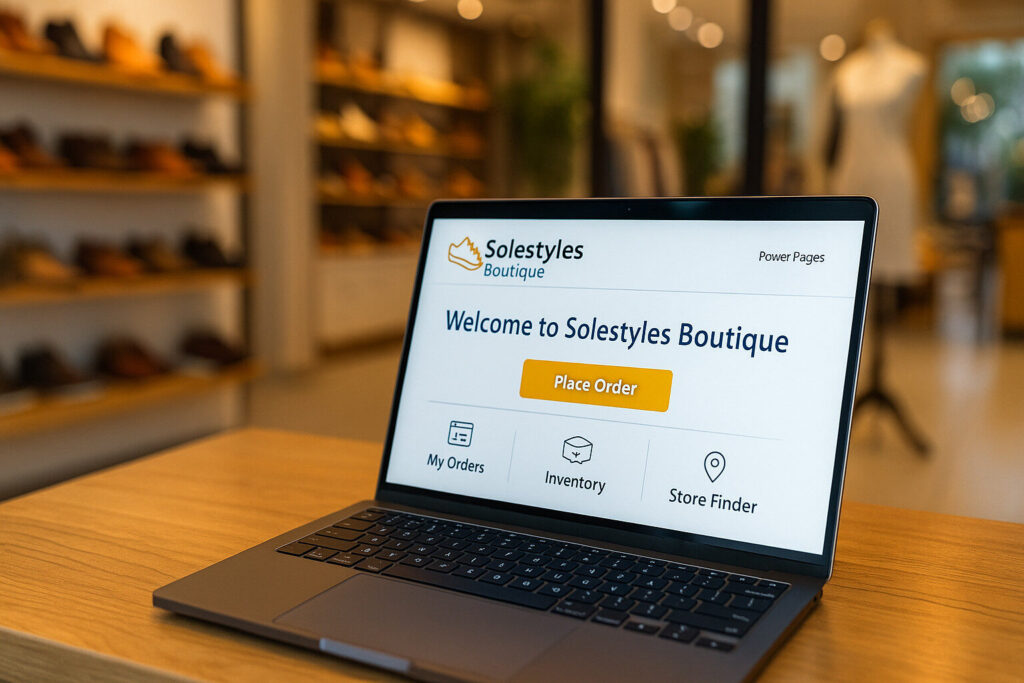
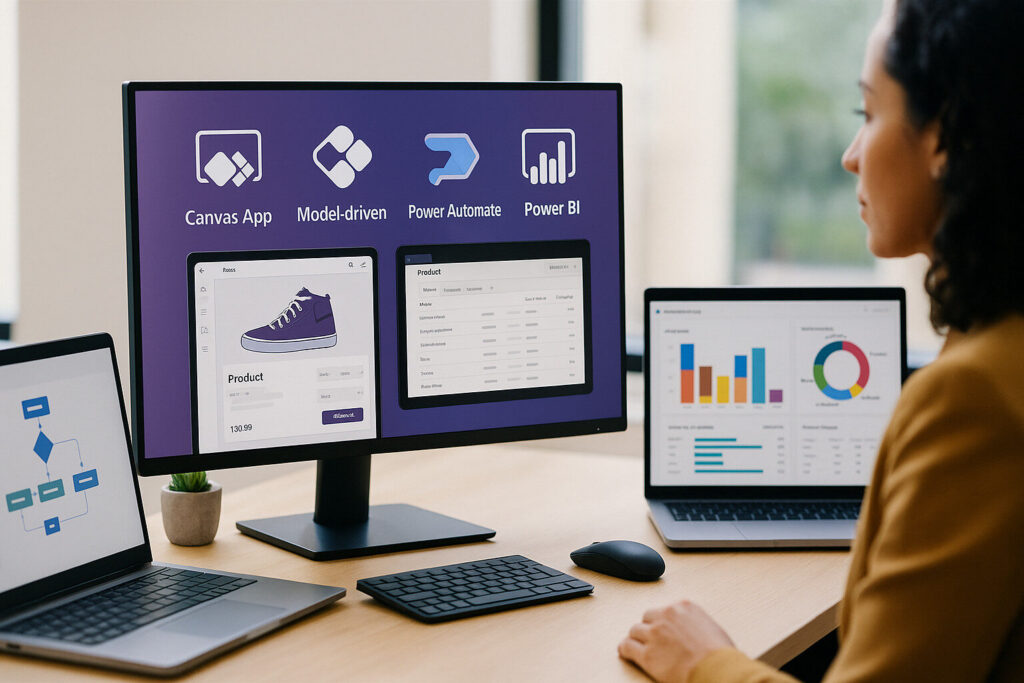
Solestyles Boutique’s Digital Transformation – Part 7 – Alternative Power Pages Option Following go-live and communication with a number of connections, I was asked about Power-Pages and what would Power Pages actually bring for a client like Solestyles Boutique. Whilst this has not been deployed to Solestyles boutique, I have permission to use the information discussed in the previous 6 posts as a factor in helping readers understand Power Pages in a more experienced (real world based) and more knowledgeable scenario. Thank you Solestyles Boutique. Introduction – Why Consider Power Pages? Following the deep dive into Solestyles Boutique’s licensing TCO in Post 6, a striking insight emerged: By shifting 2080 customer seats from Premium Per App licences (£9.20/seat/month) to a Power Pages portal, we could slash that line item by over 60 %. That equates to potential savings upwards of £10 000 per month, without compromising the core ordering experience. Note: Solestyles’ current solution wasn’t originally designed or developed for Power Pages. However, after reviewing the total cost of ownership, the management team are now evaluating Power Pages as a viable alternative for customer-facing ordering in the future. But what exactly is Power Pages, and why might it be the right fit for high-volume, customer-facing scenarios like Solestyles’ ordering portal? In this post I explore: What are Power Pages? Microsoft’s low-code web-portal platform built on Dataverse. How it differs from Canvas Apps and Model-Driven Apps in both capabilities and licensing. The key benefits it brings; scalable external authentication, built-in content delivery, responsive design and more. An alternative cost model; subscription and pay-as-you-go meters that align expenses with actual usage. Trade-offs to consider – offline support not available, UI customisation limits and portal throughput. For anyone looking to serve thousands of customers through a branded, data-driven website while keeping licence spend predictable; Power Pages is a compelling option. Let’s start by unpacking what Power Pages really is, and how it can power the next generation of Solestyles’ online storefronts. What Is Power Pages? Microsoft Power Pages is the evolution of Power Apps Portals; a secure, enterprise-grade, low-code SaaS platform for building data-driven websites on top of Dataverse. Released as a standalone product in 2023, Power Pages combines the familiarity of Power Platform with new tooling and capacity-based licensing tailored for external (anonymous or authenticated) users. The Five Design Studio Workspaces Power Pages’ browser-based Design Studio organises all portal development into five focused workspaces: PagesDrag-and-drop no-code components; text, images, lists, forms, Power BI reports and custom PCF controls; onto your web pages, using responsive templates that adapt to any device. StylingApply built-in themes or author bespoke CSS and JavaScript to match Solestyles’ brand identity, with live preview across breakpoints. DataManage your Microsoft Dataverse tables, columns, views and forms in-context defining which data drives each portal component, and enabling inline creation of new Dataverse schema. SetupConfigure site properties (URLs, languages, regional formats), environment variables, page templates and advanced site settings such as enabling custom domains or integrating external CMS services. SecurityDefine Microsoft Entra ID (formerly Azure AD) and Entra External ID authentication providers, assign web roles, configure table and row-level permissions, and enforce GDPR compliant privacy settings. Key Differentiators vs. Canvas and Model-Driven Apps Capability Canvas Apps Model-Driven Apps Power Pages Target users Internal staff/mobile Internal back-office External customers & partners UI approach Free-form drag-drop Form-and-view driven Page-and-section based, responsive Offline support Yes No No Authentication Microsoft Entra ID / B2C Microsoft Entra ID Microsoft Entra ID, External ID, local identity Licensing model Per-User / Per-App Per-User Capacity packs (authenticated/anonymous) Supported scenarios Task-oriented apps Complex processes High-volume, data-driven portals Why Power Pages for Solestyles’ Ordering Portal? 60 % licence savings by shifting 2080 customer seats to capacity packs instead of Per-App licences. Brand-first web UX with full control over HTML/CSS/JavaScript delivering a polished boutique feel. Scale to thousands of concurrent visitors via built-in CDN and caching, without per-seat overhead. Dataverse-native data integration: reuse existing product, order and customer tables, plus Power Automate flows, without additional glue code. In the next section, we’ll dive into the specific retail-focused features, catalogues, carts, checkouts and order history that you can build in Power Pages to rival any modern ecommerce site. Key Capabilities for a Retail Portal Power Pages delivers a suite of built-in features tailored for ecommerce and self-service scenarios. Here’s how Solestyles Boutique could leverage them: Catalog Browsing & Search List Components: Drag-and-drop galleries show products with configurable filters (category, size, colour). Entity Lists: Advanced search with server-side paging and sorting on Dataverse tables. Relevance Tuning: Use column-based weighting to surface bestsellers at the top. Add-to-Cart & Checkout Entity Forms: Custom forms capture cart items, quantities and options. Multi-Step Processes: Use Liquid templates and Power Automate for multi-stage checkouts (review, payment selection, confirmation). Embedded Payment Providers: Securely integrate Stripe or Adyen via JavaScript or Custom Connector calls. Order History & Self-Service Authenticated Lists: Show users their past and in-progress orders by filtering a Dataverse view by their contact record. Editable Forms: Allow address updates or cancellation requests via in-portal forms with server-side validation. Custom Branding & Responsive Design Themes: Configure corporate colours, fonts and logo in the Styling workspace. Liquid & CSS: Inject custom HTML/CSS snippets for bespoke layouts ensuring the portal matches the Solestyles boutique aesthetic on all devices. These capabilities mean customers enjoy a seamless, branded shopping experience while Solestyles reuses its existing Dataverse schema and automation flows without extra integration layers. Architecture & Data Integration A robust Power Pages solution sits on a clear, maintainable architecture that reuses Solestyles Boutique’s existing Dataverse backbone. In this section, I’ll map out the core components; portal metadata, business tables, entity permissions and explore how to embed Canvas experiences or PCF controls and integrate with external CMS or e-commerce services. Dataverse as the Single Source of Truth At the heart of Power Pages is Microsoft Dataverse, which stores both your portal configuration (webpages, content snippets, site settings and web role mappings) and your business data
Solestyles Boutique’s Digital Transformation – Part 6 – Power Platform in Action – Lessons Learned
Solestyles Boutique’s Digital Transformation – Part 6 – Power Platform in Action – Lessons Learned Introduction: Why a Series Wrap-Up? Solestyles Boutique’s journey across the Power Platform has been a story of transformation; from paper invoices and spreadsheets to a seamless blend of Canvas apps on the shop floor, Model-Driven portals for administrators, robust Power Automate flows and dynamic Power BI analytics. After five long and in-depth posts, it’s time to step back, reflect on what has been achieved and explore how these lessons apply to any business regardless of their size, location and complexity. This final post will: Recap the core value of each platform component and the problems they solved. Extract universal take-aways, guiding principles for low-code success. Walk through a real-world licensing example, using a 20-store Solestyles boutique example scenario to illustrate the latest Power Platform licence models and Dataverse storage considerations. Gaze into the future, with AI-driven innovations and Copilot for Power Platform that promise to reshape how we build and use low-code solutions. Whether you’ve followed every post in the series or are joining here for the first time, this wrap-up will help you connect the dots, avoid common pitfalls and chart a clear path forward; empowering your organisation to harness the full potential of the Power Platform. Let’s begin with a quick stroll through the series highlights. Series Recap: From Canvas to Analytics Over the last five posts, I have guided Solestyles Boutique from paper-bound chaos to a fully integrated, low-code platform powering every aspect of its business: Post 1: From Paper Trails to Platform PowerThe stage is set for replacing aging spreadsheets and invoices with a unified Dataverse backbone establishing the central repository for products, orders and customers, and defining the business drivers for a mobile-friendly, secure system. Post 2: Designing Solestyles’ Canvas AppNext,a tablet-optimised Canvas App is crafted for shop-floor staff: a simple gallery-to-detail-to-cart flow, fully offline-capable, with “Add to Cart,” checkout screens and a seamless “Pay Now” integration that syncs back to Dataverse. Post 3: Unlocking Power Apps Model-DrivenFor the back-office, a Model-Driven App is introduced: rich order and inventory forms, Custom Business Process Flows for approvals, embedded Power BI dashboards, and role-based security that gives assistants and managers just the data they need. Post 4: Mastering Power AutomateManual business process flows were then automated; payments, order creation, stock adjustments and special-order notifications with solution-aware flows. Error-handling scopes, retry patterns and scheduled low-stock reports ensured every process ran reliably while Teams alerts kept the buying team in the loop. Post 5: Power BI Analytics Deep DiveFinally, a star-schema model in Power BI was built, authored DAX measures like Total Sales and Stock Turnover, designed interactive dashboards aligned to the Solestyles brand, and implemented refresh strategies from incremental to near real-time so managers always see the freshest insights. Together, these posts form an end-to-end blueprint: a single “Solestyles Boutique” solution where Canvas Apps, Model-Driven Apps, Automation and Analytics work together. Universal Takeaways for Any Business While Solestyles Boutique’s story is unique, the principles that powered its transformation apply to organisations of every size and sector. Here are the five pillars to guide your own Power Platform journey: 1. Embrace a Single-Solution Mindset Whether you’re building a Canvas App for frontline staff, a Model-Driven portal for managers, or flows and reports to automate and analyse your data, house everything in one solution container. This approach streamlines ALM, keeps versioning consistent and makes it trivial to migrate from Dev to Test to Production without breaking connections or losing environment-specific settings. 2. Design with the User at the Centre Never underestimate the power of user-centred design. Conduct discovery workshops to map out every persona’s daily tasks: Shop assistants need offline galleries and quick-add cart functionality Store managers want clear dashboards and approvals in one place Executives require high-level trends at a glance. Prioritise intuitive navigation, responsive layouts and just-in-time guidance (like Business Process Flows and in-app help) to maximise adoption and minimise training overhead. 3. Treat Data as Your North Star Centralise all product, order and customer information in Dataverse and resist the urge to scatter data in spreadsheets or ad-hoc lists. A clean, well-modelled data layer (with lookups, calculated and roll-up columns) underpins every Canvas App screen, flow logic and Power BI report. By enforcing referential integrity and reusing environment variables and connection references, you ensure that every component reads from and writes to a single source of truth. 4. Build Resilience & Observability Real-world systems need to tolerate failures; offline-first caching for poor connectivity, run-after and retry patterns for transient API errors, logging failures into Dataverse or Application Insights for post-mortem analysis, and scheduled health checks that alert you before small issues become business-critical outages. Adopt these patterns early to maintain continuous operations and build stakeholder trust. 5. Embed Governance from Day One It’s easy to start small and spiral into shadow solutions. From the very first commit, define Data Loss Prevention policies, enforce security roles and field-level permissions, establish naming conventions and version controls, and leverage the CoE Starter Kit to monitor maker activity and policy compliance. A lightweight governance layer preserves agility while ensuring your platform scales securely. By internalising these universal take-aways; single-solution ALM, user-centric design, data-first architecture, resilient operations, and proactive governance; you’ll be well equipped to replicate Solestyles’ success in your own organisation. Licensing & Storage: A Solestyles Boutique (Potential Future) Case Study All prices are accurate up to and including 2 July 2025 and exclude VAT. Costs are based on an annual purchase rate, but divided into a monthly price record. These estimates adhere to Microsoft’s latest published list prices and recommended best practices balancing full functionality with cost efficiency. High-Level Summary Over the last few years, Solestyles Boutique has has grown from a single shop on a West Yorkshire high street to a multi-channel retailer juggling in-store sales, weekend pop-ups and an online storefront to a business that now has 20 stores
Solestyles Boutique Digital Transformation – Part 5 – Power BI Analytics Deep Dive

Solestyles Boutique’s Digital Transformation – Part 5 – Power BI Analytics Deep Dive In today’s data-driven retail landscape, rapid access to clear, actionable insights is just as critical as a flawless customer experience on the shop floor. While Solestyles Boutique’s Canvas App empowers front-line staff and the Model-Driven App guides back-office workflows, neither can surface high-level trends or forecast demand on its own. Enter Power BI: Microsoft’s flagship analytics platform that transforms raw data into rich, interactive dashboards. Solestyles Boutique has grown from a single shop on West Yorkshire high street to a multi-channel retailer juggling in-store sales, weekend pop-ups and an online storefront. Yet when management needed to answer simple questions: “Which collection is underperforming this week?” or “How many black loafers remain in Stock?” they found themselves cobbling together Excel exports and lists, with data often days out of date. Decisions made on stale figures carried real risks: Stockouts Missed promotions, and Overstretched cash flow To close this gap, Power BI was introduced as the central analytics layer feeding the low-code power platform. Why Power BI for Solestyles? Because: Seamless Dataverse Integration – The Canvas and Model-Driven apps already write every sale, stock adjustment and customer interaction into Dataverse. Power BI connects natively via DirectQuery for live views or import mode with incremental refresh for a single source of truth. Tailored Refresh Measurement – Whether triggering hourly imports in Premium capacity or employing DirectQuery for near real-time stock levels, refresh schedules were configured that match Solestyles’ operational tempo – no more end-of-day surprises. Rich, Interactive Visuals – Beyond static tables, intuitive dashboards were crafted to empower managers to spot issues before they escalate: Daily sales trends, Stock-turn rates, Heat maps of customer locations, and What-if analysis for upcoming launches Embedded and Accessible – Dashboards live not only in the Power BI service but are embedded directly into the Model-Driven Admin portal and surfaced in the Canvas App. Anywhere a decision is made, the latest metrics are just a tap away. These innovations together with seamless direct connectivity to Dataverse and support for both import-mode and DirectQuery, mean that store managers, procurement leads and the executive team can all explore sales velocity, stock-turn rates and seasonal trends in real time. In this post, I’ll dive into how Solestyles configures, models and visualises its data in Power BI, ensuring every decision is backed by the freshest possible insights. I’ll take you step by step through the: Connection of Power BI to Solestyles’ data, Modelling a star schema tailored for retail analytics, Writing DAX measures that capture key performance indicators, and Designing dashboards that keep the business agile. By the end of this post, you’ll have a blueprint for turning raw Dataverse records into strategic insights ensuring your own personal decisions are guided by the Soulstyles experience and example information. Connecting to Your Data Sources Before building your Power BI visuals, you must establish dependable, performant connections to your operational data primarily housed in Dataverse (recommended), with supplementary sources for Canvas App collections. I’ll explore the two main Dataverse methods (Connector vs OData), strategies for pulling in Canvas App data, and how to blend multiple sources with Power Query. Dataverse Connector vs. OData Feed Power BI Desktop offers two first-party options for Dataverse: Power BI Dataverse Connector Uses the Tabular Data Stream (TDS) protocol for both Import and DirectQuery modes. Recommended for most scenarios because it supports server-side filtering, relationships and choice columns natively. Prerequisite: The Dataverse TDS endpoint must be enabled in your environment (admin setting in the Power Platform Admin Center). OData Feed (Common Data Service Legacy) Exposes an OData v4 endpoint to query tables via HTTP GET requests. Best suited for small, read-only extracts or when leveraging dataflows to migrate between environments. Lacks full support for choice columns and can incur pagination-related performance issues on large tables. Recommended approach: Use the Dataverse Connector in Import mode for datasets under 100 MB, switching to DirectQuery for real-time needs (e.g., live stock levels). Reserve OData for lightweight dataflows or niche migration tasks. Importing Canvas App Collections Your Canvas App caches critical lookup tables; example – categories, suppliers and static lists; in local collections. To mirror these in Power BI: Expose Collections via SharePoint or Azure Data Lake If a Canvas App saves collections to SharePoint lists, connect via SharePoint Online List in Power BI: Source = SharePoint.Tables(“https://yourtenant.sharepoint.com/sites/solestyles”, [Implementation=”2.0″]) Alternatively, use Power Automate to write collections to an Azure Data Lake Gen2 CSV or Parquet file (large data storage option); then ingest with the Azure Data Lake Storage connector. Refresh Coordination Schedule your Power Automate flow that exports collections immediately before your Power BI dataset refresh to ensure lookup tables stay in sync with Dataverse. Combining Multiple Sources with Power Query Once connected, blend Dataverse tables and Canvas App collections in Power Query: Merge Queries In Power Query Editor, use Merge Queries to join fact tables (e.g., Orders) with dimension tables (Products, Contacts, colCategories). Query Folding For DirectQuery and the Dataverse Connector, ensure transformations (filters, column selections) fold back to the source to minimise client-side processing. Check each step’s View Native Query to confirm folding. Data Type & Privacy Settings Explicitly set column Data Types (Date, Decimal, Text) in the first transformation step to avoid errors. Configure Privacy Levels per source (Organizational for Dataverse, Public for Azure Data Lake) in File → Options → Privacy to prevent unnecessary data isolation throws. Security and Governance Considerations Row-Level Security (RLS) Define RLS roles in Power BI Desktop to restrict users to their allowed data slices (e.g., managers see all regions, store staff only their own). Credential Management In the Power BI Service, store credentials in the dataset’s Data source credentials pane choosing OAuth2 for the Dataverse connector so that each user’s security roles apply at query time. Gateway Requirements For on-premises Data Lake or SharePoint data, ensure the On-Premises Data Gateway is configured in